
Istio within GKE
istio namespace
Let’s take a look at Istio’s namespace to see what has been deployed by GKE.
Services
The following command should return the Istio services that were created during the deployment:
Λ\: $ kubectl get services --namespace istio-systemNAME TYPE CLUSTER-IP EXTERNAL-IP PORT(S) AGE
istio-citadel ClusterIP 10.121.3.135 <none> 8060/TCP,15014/TCP 3m44s
istio-galley ClusterIP 10.121.2.73 <none> 443/TCP,15014/TCP,9901/TCP 3m44s
istio-ingressgateway LoadBalancer 10.121.4.19 35.228.255.37 (1)
15020:31451/TCP,80:30014/TCP,443:31704/TCP,31400:32549/TCP,15029:32055/TCP,15030:31472/TCP,15031:31783/TCP,15032:31047/TCP,15443:31788/TCP 3m44s
istio-pilot ClusterIP 10.121.10.254 <none> 15010/TCP,15011/TCP,8080/TCP,15014/TCP 3m43s
istio-policy ClusterIP 10.121.15.82 <none> 9091/TCP,15004/TCP,15014/TCP 3m43s
istio-sidecar-injector ClusterIP 10.121.8.21 <none> 443/TCP 3m43s
istio-telemetry ClusterIP 10.121.4.162 <none> 9091/TCP,15004/TCP,15014/TCP,42422/TCP 3m43s
promsd ClusterIP 10.121.8.199 <none> 9090/TCP 3m43s| 1 | Here, you see the external IP of your cluster |
|
Save the ingress gateway external IP to |
Pods
Moreover, we can take a look at the pods used inside this namespace with the following command:
Λ\: $ kubectl get pods --namespace istio-systemNAME READY STATUS RESTARTS AGE
istio-citadel-554b499885-xpfnb 1/1 Running 0 16m
istio-galley-7954555f7b-2w6fl 1/1 Running 0 16m
istio-ingressgateway-6d8f9d87f8-vh52w 1/1 Running 0 16m
istio-pilot-78d6847769-z97dc 2/2 Running 0 16m
istio-policy-6b799c557-mgbsw 2/2 Running 0 16m
istio-sidecar-injector-8cd757776-2h78g 1/1 Running 0 16m
istio-telemetry-799668466f-jph6d 2/2 Running 0 16m
promsd-76f8d4cff8-wl97r 2/2 Running 0 16mWe can see the system has only one instance of each component. GKE provides configurable features to allow scaling up some of the core components.
To get an idea of which component can be modified in GKE, please refer to https://cloud.google.com/istio/docs/istio-on-gke/overview#modifying_control_plane_settings
Cloud Operations
Cloud Operations is Google Cloud’s managed logging and monitoring service. It has many features we will be using to watch our cluster and visualize what is actually happening.
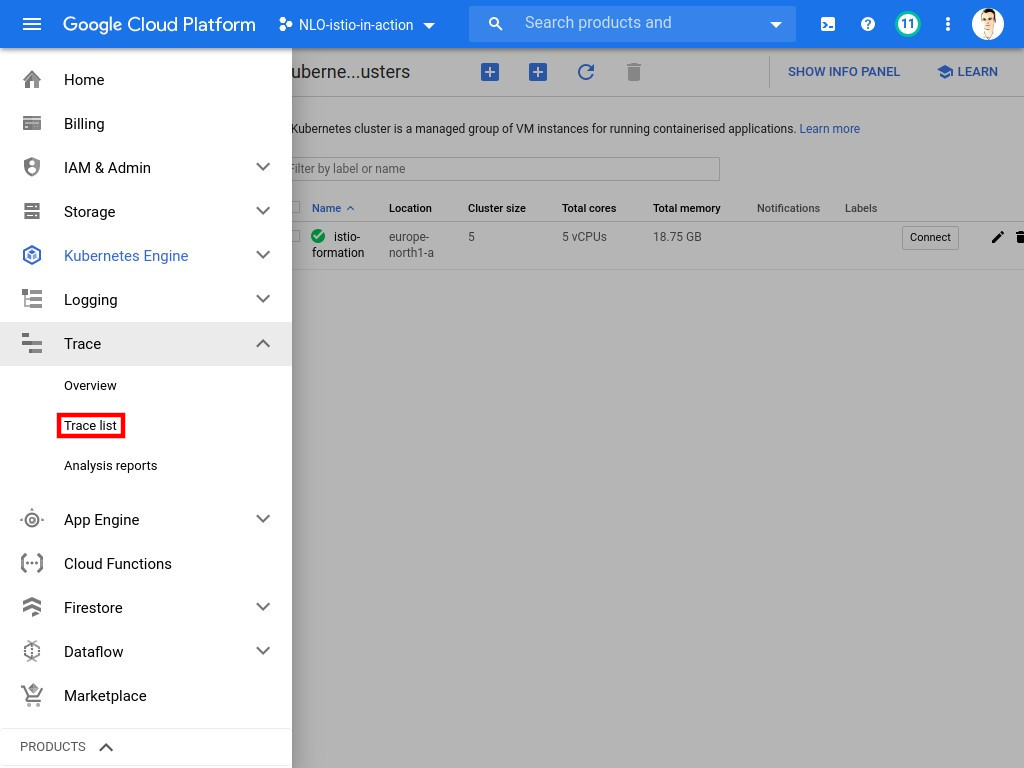
Trace 🚩
You can access the Trace list through the cloud console by clicking on the Trace list menu button.
|
To activate trace exports to Cloud Operations, you need to run following command: |
There, you will find a screen which shows the distributed traces inside your cluster. For now, of course, the system is empty 😅
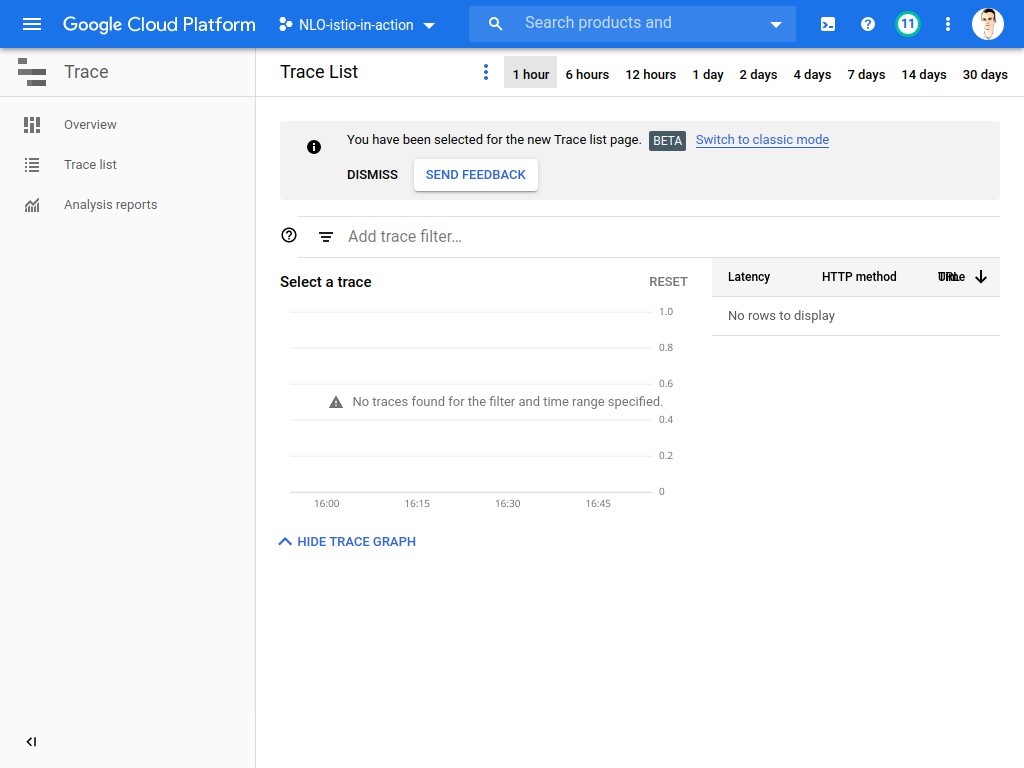
| This view will be used later in the workshop, so keep a link to it ! |
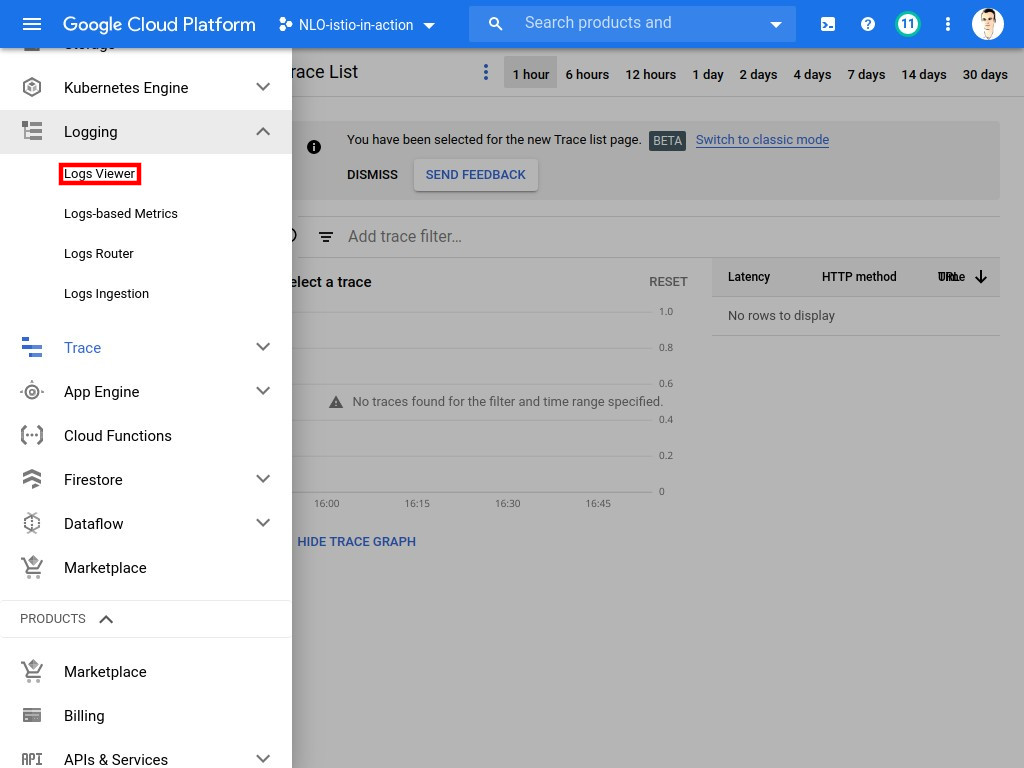
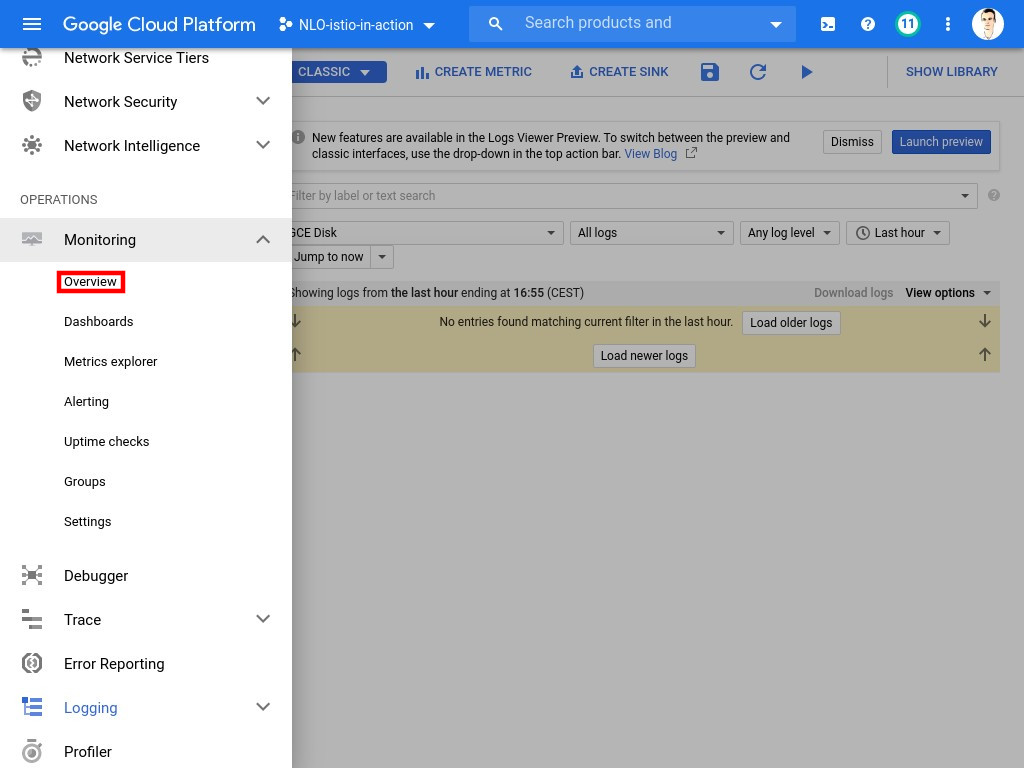
Logging
You can access the Logs section through the console, with the Logging button in the side bar.
Here, you may see logs from all the components in the project, and in our case, those from the containers and the cluster.
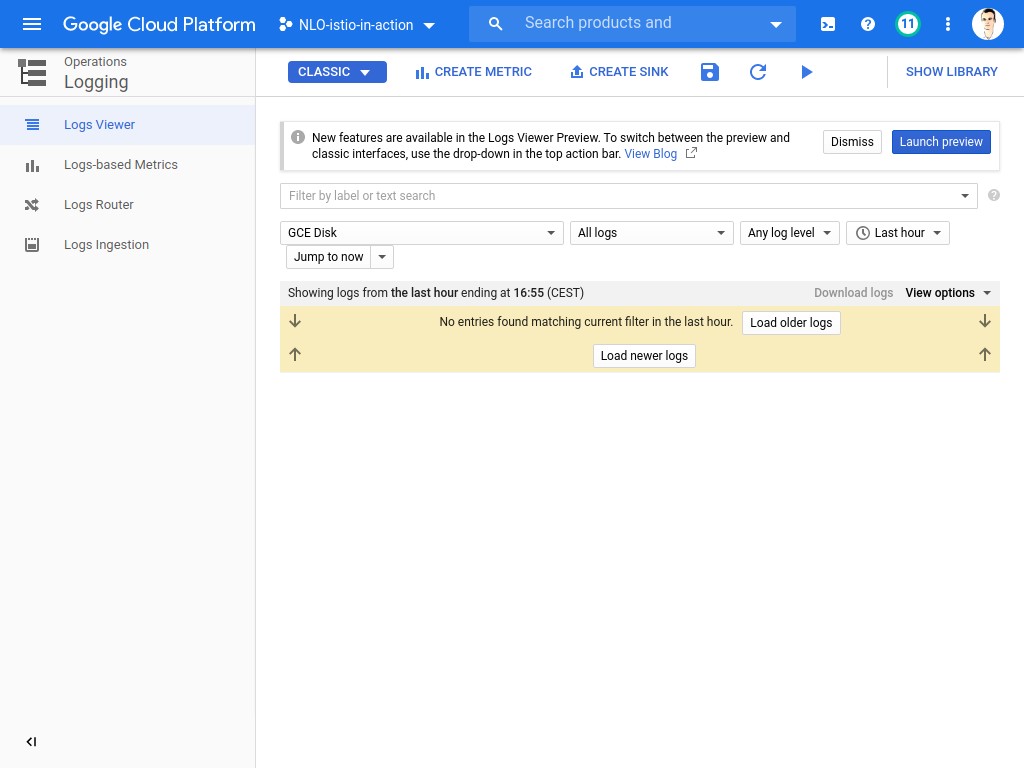
| This view will be used later in the formation, so keep a link to it ! |
Monitoring
You can access the Cloud Operations monitoring dashboard with the Monitoring menu button.
You should end up in a custom interface (outside of the Google Cloud Console) dedicated to the monitoring operation.
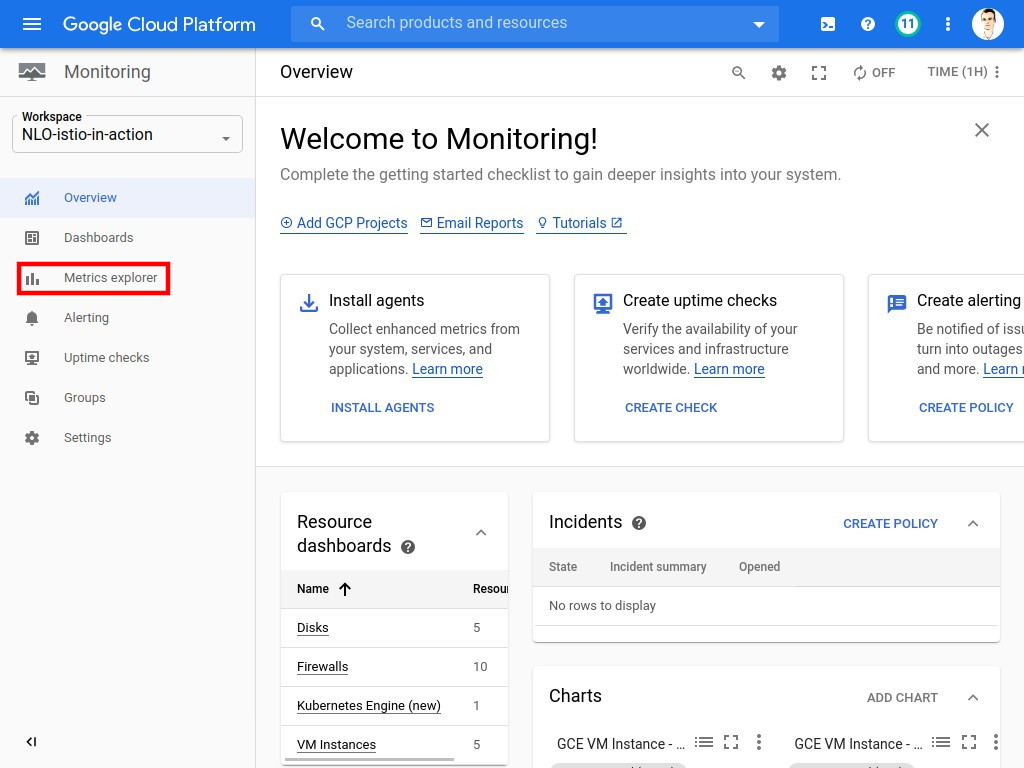
Open the monitoring interface by clicking on Metrics explorer.
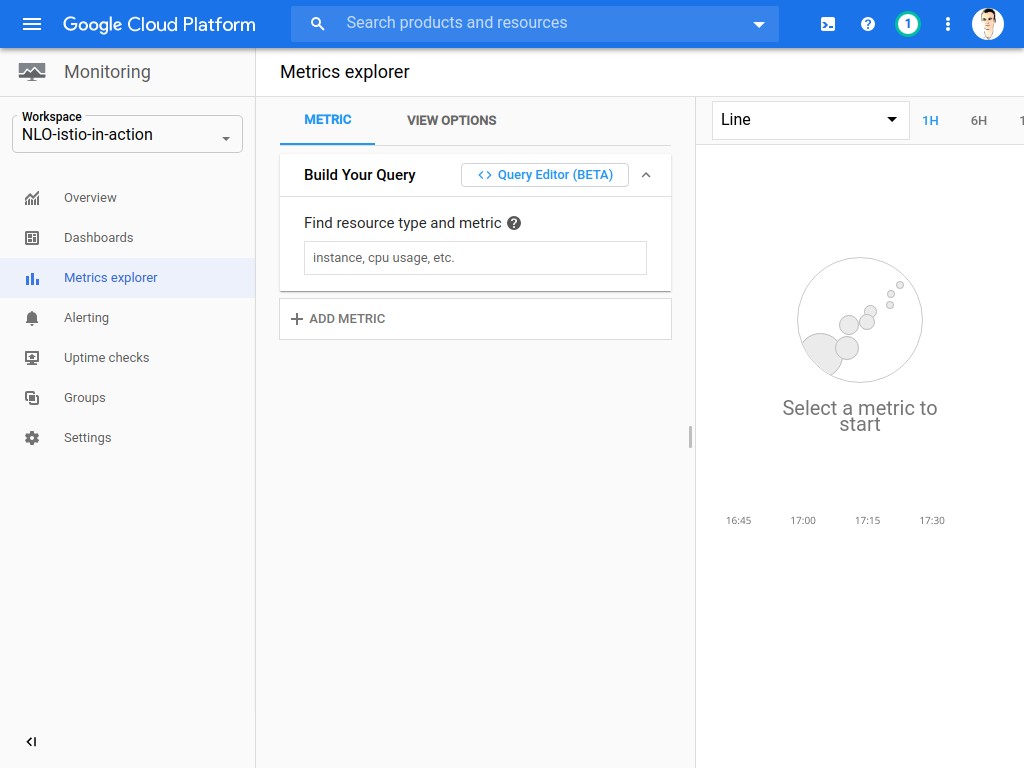
| This view will be used later on to build metrics for our cluster, so keep a link to it ! |